The Actionable Google Marketing Looker Studio Template (GA4, Google Ads, Search Console)

Stop Wasting Your Marketing Budget. Start Making Confident Decisions.

The Actionable Google Marketing Looker Studio Template turns your Google Analytics 4 (GA4), Google Ads, and Search Console data into the answers you need for your most important marketing questions.

Looker Studio’s Data Control allows you to use the template with your own data – free!

Are Your Marketing Dashboard Full of Colouful Charts but You Still Can’t Figure Out What’s Actually Working or What to Do Next?

You are running Google Ads, optimising for search, and tracking it all in Google Analytics 4 (GA4). But:

  • You pour money into a Google Ads campaign, crossing your fingers that it’s working, but can’t draw a straight line from your ad spend to a single sale?.
  • You stare at your GA4 dashboard, see traffic going up, but have no idea if it’s the right traffic?
  • You suspect some marketing channels are wasting money, but you can’t prove it?
  • You make marketing decisions based on gut feeling instead of data?

The result? You are either missing profitable opportunities or throwing money at marketing that doesn’t work. Both cost you thousands.
You are not alone. Most marketing dashboards give you more data, not more clarity.

Dashboards Shouldn’t Just Show You Numbers; They Should Answer Your Questions & Guide You to Your Next Action

The Looker Studio Template that Makes Your GA4, Google Ads and Search Console Data Work For You

Imagine logging in and, in 90 seconds, not only seeing your key metrics but also having a clear actions to improve them.

  • See exactly which marketing channels bring in paying customers.
  • Identify campaigns that waste money (so you can stop them today).
  • Discover your most profitable traffic sources.
  • Get specific action plans; not just pretty charts.

That’s not a dashboard; that’s a battle plan.

The Actionable Measurement Framework: Strategy-First Analytics

This template isn’t just about numbers; it’s built on our unique Actionable Measurement Framework to help businesses achieve data-driven growth.

1

Ask the Right Questions

Stop guessing. Our template is built around the Key Performance Questions every marketer needs to ask, focusing your attention on what truly drives results.

2

Get Clear Answers

The dashboard automatically uses your GA4, Google Ads, and Search Console data to give you straightforward answers in plain English – not just more confusing charts.

3

Take Confident Action

Know your next move. The dashboard provides ‘If-Then’ suggestions, turning insights into a clear, actionable to-do list.

An Actionable Dashboard for Every Part of Your Marketing

The Actionable Google Marketing Looker Studio Template translates your data into clear, confident decisions.

Get Answers to Your Google Marketing Questions At-a-Glance

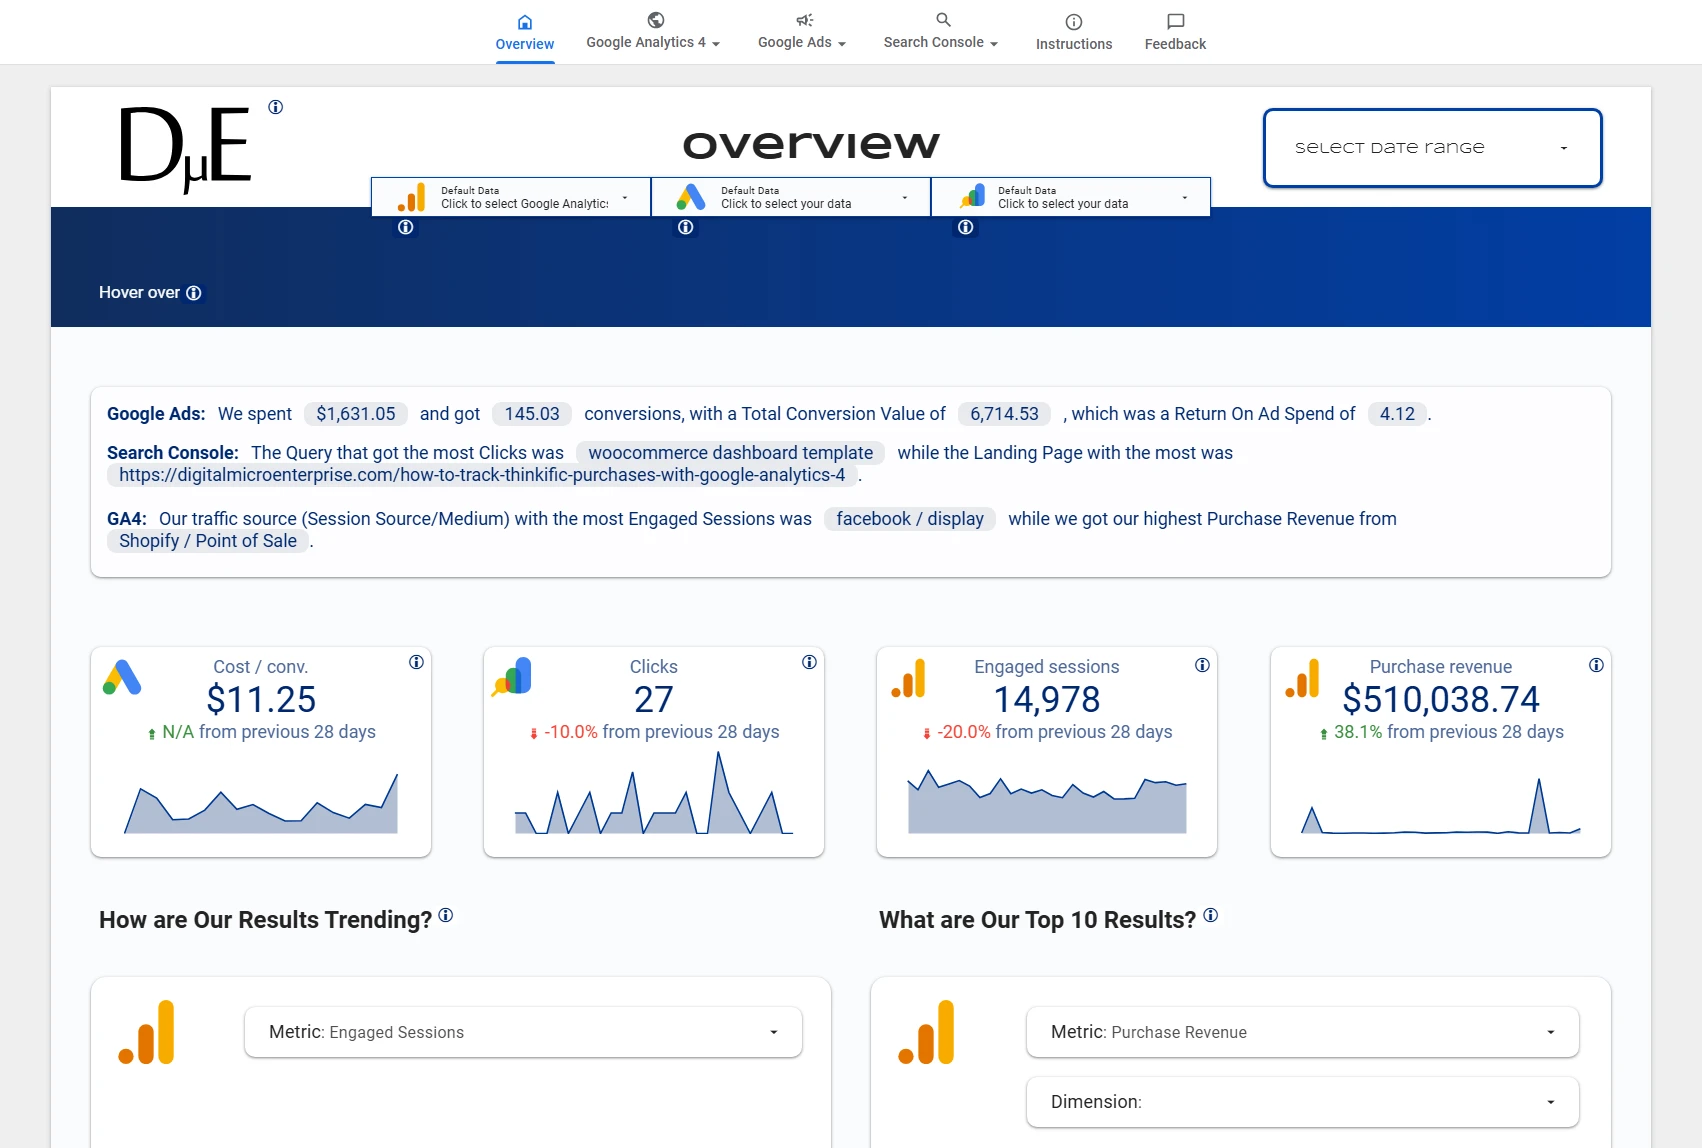
The Overview page is your strategic starting point. Instead of jumping between Google Analytics, Google Ads and Search Console, it is designed to give you an immediate, at-a-glance answers to your marketing questions.

Actionable Google Marketing Looker Studio Template - Top of Overview Page

After getting an initial high level view of the status of you marketing on the Overview page, you can go to the pages of the other sections for more details.

Go from Big Picture to Fine Grained Details

Rather than a wall of numbers and you don’t know where to start, the template shows you what you need to look at first, and then it’s structure inherently leads to what to look at next.

After getting the Big Picture and the top of the overview page, you can go further down the page for more details. Sometimes that will be all you need, but inevitably, questions will arise and you will need more details to answer them. This is where the dedicated sections of the Template comes into play. These are:

  • Actionable GA4 Looker Studio Reports
  • Actionable Google Ads Looker Studio Reports
  • Actionable Search Console Looker Studio Reports

Actionable GA4 Looker Studio Reports

Transform your Google Analytics 4 confusion into crystal-clear customer journey insights.

  • See which traffic sources actually convert (not just which ones look impressive).
  • Identify pages where engaged visitors aren’t buying.
  • Track the metrics that matter to your bottom line, not just your ego.

Actionable Google Ads Looker Studio Reports

Stop burning money on ads that don’t work.

  • Instantly spot campaigns with terrible ROI before they drain your budget.
  • Find profitable keywords you’re missing and expensive ones you should drop.
  • See your true cost per customer (not just cost per click).

Actionable Search Console Looker Studio Reports

Turn your SEO efforts into a strategic advantage

  • Discover “quick win” keywords you’re already ranking for (but not optimizing).
  • Find pages with high impressions but low clicks (huge opportunity).
  • Track the organic performance that actually drives business results.

Dynamic English Summaries and Contextual Information

The template features summaries to make information better context so in is more digestible.

Animated webP image of Top of Overview page showing dynamic text that gives information about Google Ads, Search Console and GA4 performance. The animation shows the date picker being used and the dynamic text changes based on the date range selected.


Explore Interactively to Get Deeper Answers to Your Questions

The most important information is shown by default in each page. However, for an dashboard to be Actionable, it must not just present data, it must give you the ability to explore more so that you can diagnose any issues that need attention.

Explore Using Drop-downs for Dynamic Metrics & Dimensions

All the reporting pages features visualisations that allow you the change the metric or both the metric on dimension using dropdowns. This offers a very beginner friendly way of exploring you data so you can get the answers to take action.

Animated webP image showing choosing different metric and dimension combination using dropdowns that cause a horizontal bar chart to show information based on what was selected.

  • How it Works: These charts use dynamic metric and dimension selectors. You can choose a metric from the dropdown (e.g., change from “Purchase Revenue” to “Engaged Sessions”), and the chart will instantly update to answer your new question.

Explore Using Drill Action in Tables

Though they can be tricky to get used to at first, Drill Actions in tables are an extremely powerful way to explore your data. It allows you to do in one table that would otherwise involve multiple tables and/or pages. It gives you the ability to

  • Change the dimension a table.
  • Mix different combinations of dimensions.
  • Remove the dimensions so you get a summary.
  • Drill on a particular value of a dimension and see the results based on anther dimension
    • Eg Filter on a particular Campaign and then select Country so the table shows all the Countries visitors of that Campaign came from.

Animated webP image showing using Drill Action on the first two columns on a Table with GA4 data.

Actionable Insights to Actual Actions

The true power of this template lies in guidance to your most important business questions. The Questions AnD Actions (QnA) section, found on the detailed report pages (e.g., GA4 Purchase: Session, Google Ads: Explore), is your command centre for turning curiosity into strategy.

Instead of waiting to spot a problem, you can begin with a question you have about your business.

Questions AnD Actions section showing dropdown to select a question and an area with formatted text where actions are shown
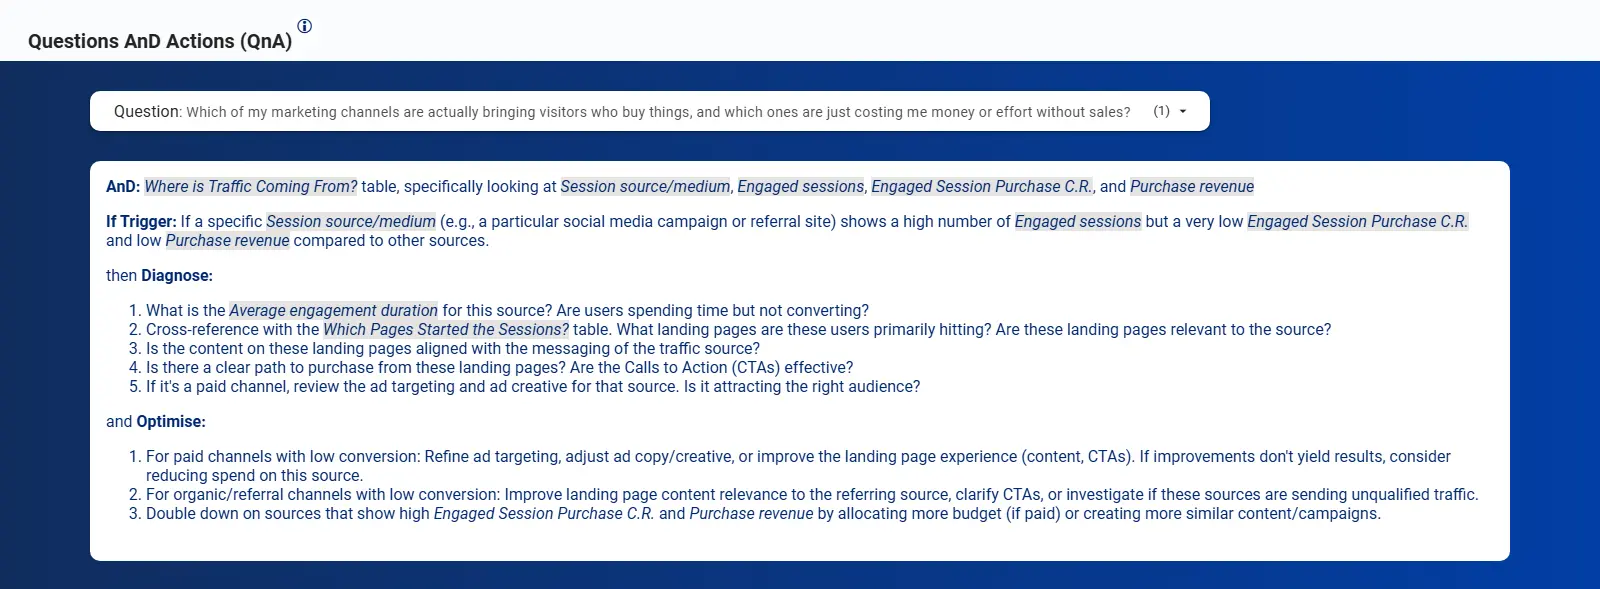
The QnA feature provides a structured path to find answers in your data, diagnose performance, and take clear, data-informed steps to improve your business.

From Analytics to Action: Sample Marketing Diagnoses

Are our marketing campaigns being tracked effectively with UTMs?

If Trigger: In the Where is Traffic Coming From? table, you observe a significant number of Engaged sessions or Purchase revenue attributed to generic or unexpected Session source / medium values like (direct) / (none), google / organic from paid campaigns, or from specific referral sources that should be campaign traffic (e.g., a social media site where you are running ads).

then Diagnose:

  1. Isolate Ambiguous Traffic: Filter the page to show only the (direct) / (none) traffic. Examine the associated landing pages in the Which Pages Started the Sessions? table. Are these landing pages primarily used in specific marketing campaigns (e.g., email newsletters, social media profiles)?
  2. Check Referral Traffic: Look at traffic from referral sources that are also paid channels (e.g., facebook.com / referral, linkedin.com / referral). If these sources are generating conversions but are not categorized under a specific campaign, it indicates that paid links are not properly tagged.
  3. Review Organic Traffic from Paid Campaigns: If you suspect paid search traffic is being miscategorized as organic, cross-reference the landing pages with your Google Ads campaigns. Are your paid ad URLs missing UTM parameters?

and Optimise:

  • Implement a Consistent UTM Strategy: Create and enforce a standardized process for generating UTM parameters for all marketing links (email, social media, paid ads, QR codes, etc.). Use a consistent naming convention for utm_source, utm_medium, and utm_campaign.
  • Use a UTM Builder Tool: Employ a URL builder tool to ensure parameters are created correctly and consistently, minimizing human error.
  • Audit Campaign Links: Review all active marketing campaigns and update any URLs that are missing UTM parameters. Ensure that email links, social media profile links, and ad destination URLs are all properly tagged.
  • Auto-tagging in Google Ads: For Google Ads, ensure that auto-tagging is enabled in your account settings. This automatically adds the gclid (Google Click ID) which allows for detailed reporting between Google Ads and Google Analytics. While auto-tagging is best practice, ensure you do not have manual UTMs that could conflict with it.

Which of my marketing channels are actually bringing visitors who buy things, and which ones are just costing me money or effort without sales?

If Trigger: If a specific Session source/medium (e.g., a particular social media campaign or referral site) shows a high number of Engaged sessions but a very low Engaged Session Purchase C.R. and low Purchase revenue compared to other sources.

then Diagnose:

  1. What is the Average engagement duration for this source? Are users spending time but not converting?
  2. Cross-reference with the Which Pages Started the Sessions? table. What landing pages are these users primarily hitting? Are these landing pages relevant to the source?
  3. Is the content on these landing pages aligned with the messaging of the traffic source?
  4. Is there a clear path to purchase from these landing pages? Are the Calls to Action (CTAs) effective?
  5. If it’s a paid channel, review the ad targeting and ad creative for that source. Is it attracting the right audience?

and Optimise:

  1. For paid channels with low conversion: Refine ad targeting, adjust ad copy/creative, or improve the landing page experience (content, CTAs). If improvements don’t yield results, consider reducing spend on this source.
  2. For organic/referral channels with low conversion: Improve landing page content relevance to the referring source, clarify CTAs, or investigate if these sources are sending unqualified traffic.
  3. Double down on sources that show high Engaged Session Purchase C.R. and Purchase revenue by allocating more budget (if paid) or creating more similar content/campaigns.

What's Inside the Template: Every Report Explained

Overview

Think of these as your top-level Key Performance Indicators (KPIs).

  1. “How much are we spending on Google Ads on average, to get a conversion?”
    • KPI: Cost/conv. (Cost Per Conversion)
    • Why it’s important: This tells you if your paid advertising is profitable. If it costs you more to acquire a customer than the profit you make from them, your strategy is unsustainable.
    • What to do (The Trigger): If this cost is higher than your profit margin or has increased significantly, the tooltip guides you to examine the “Cost Per Conversion” bar chart right on this page to see which specific campaigns are most expensive. This is your first step to optimising your ad spend.
  2. “Are more people finding and clicking on my site from free Google search results?”
    • KPI: Clicks
    • Why it’s important: This measures the health of your organic search presence (SEO). It tells you how effectively you are attracting free traffic from Google.
    • What to do: If clicks are increasing, your SEO efforts are likely paying off. If they are stagnant or decreasing, the tooltip guides you to the detailed Search Console pages in this report to analyse which search queries or pages are underperforming.
  3. “Are more genuinely interested people visiting my website?”
    • KPI: Engaged sessions
    • Why it’s important: Before anything else, you need to know if your marketing is attracting an engaged audience. This metric, from GA4, tells you how many visits involved genuine interaction.
    • What to do: If this number is trending down, it’s a signal to investigate where your quality traffic comes from. The tooltip on the scorecard guides you to use the “Top 10 Results” chart on this page to see your top traffic sources.
  4. “Are visits to our site leading to more revenue over time?”
    • KPI: Purchase revenue
    • Why it’s important: This is your bottom line. It directly answers whether your marketing efforts are translating into sales.
    • What to do (The Trigger): The true power comes from comparing this to your Engaged sessions. If Engaged sessions are increasing, but Purchase revenue is flat or decreasing, this is a critical trigger for action. It suggests you have an engaged audience that isn’t converting. The built-in tooltip and the QnA section on the GA4 pages are designed to guide you through diagnosing this exact problem.

GA4 Purchase: Session

If no other GA4 Ecommerce events are implemented other than the purchase event.

Top of the GA4 purchase page of the GA4 Looker Studio Template showing the dropdowns available and five scorecards

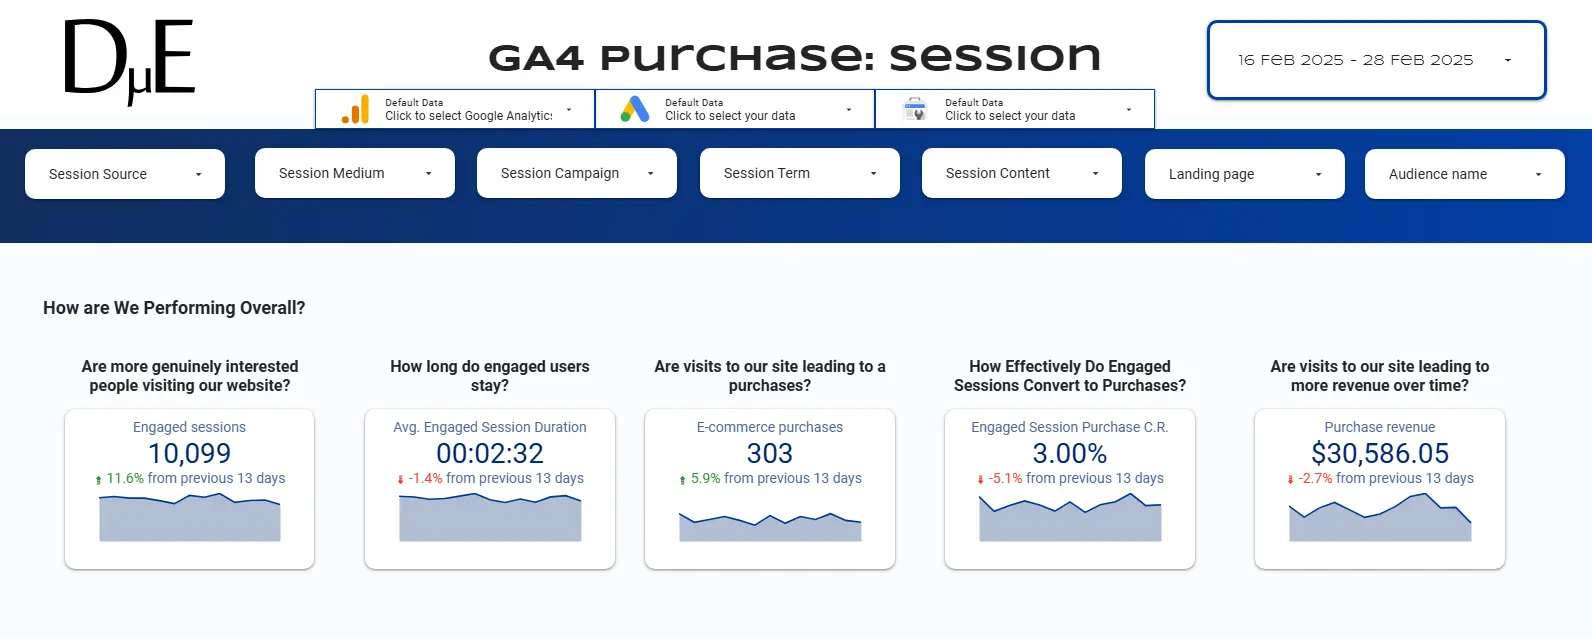
  • What is the overall engagement level?
  • How long do engaged users stay?
  • What is the conversion rate of engaged sessions to purchases?
  • What is the total revenue?
  • What are the detailed performance metrics for each traffic source and medium?
  • Which sources drive the most engaged traffic and conversions?
  • What is the conversion performance of different landing pages?
  • Which products are purchased most often, and what revenue do they generate?

GA4 Purchase: User

Shifts the focus from session-scoped data to user-scoped data from GA4, specifically for purchases. This allows for analysis based on first-user interactions.

  • How many active users are there?
  • How engaged are they on average?
  • What is the purchase conversion rate for active users?
  • What is the average revenue generated per paying user?

Google Ads Explore

This page is dedicated to analysing the performance of Google Ads campaigns.
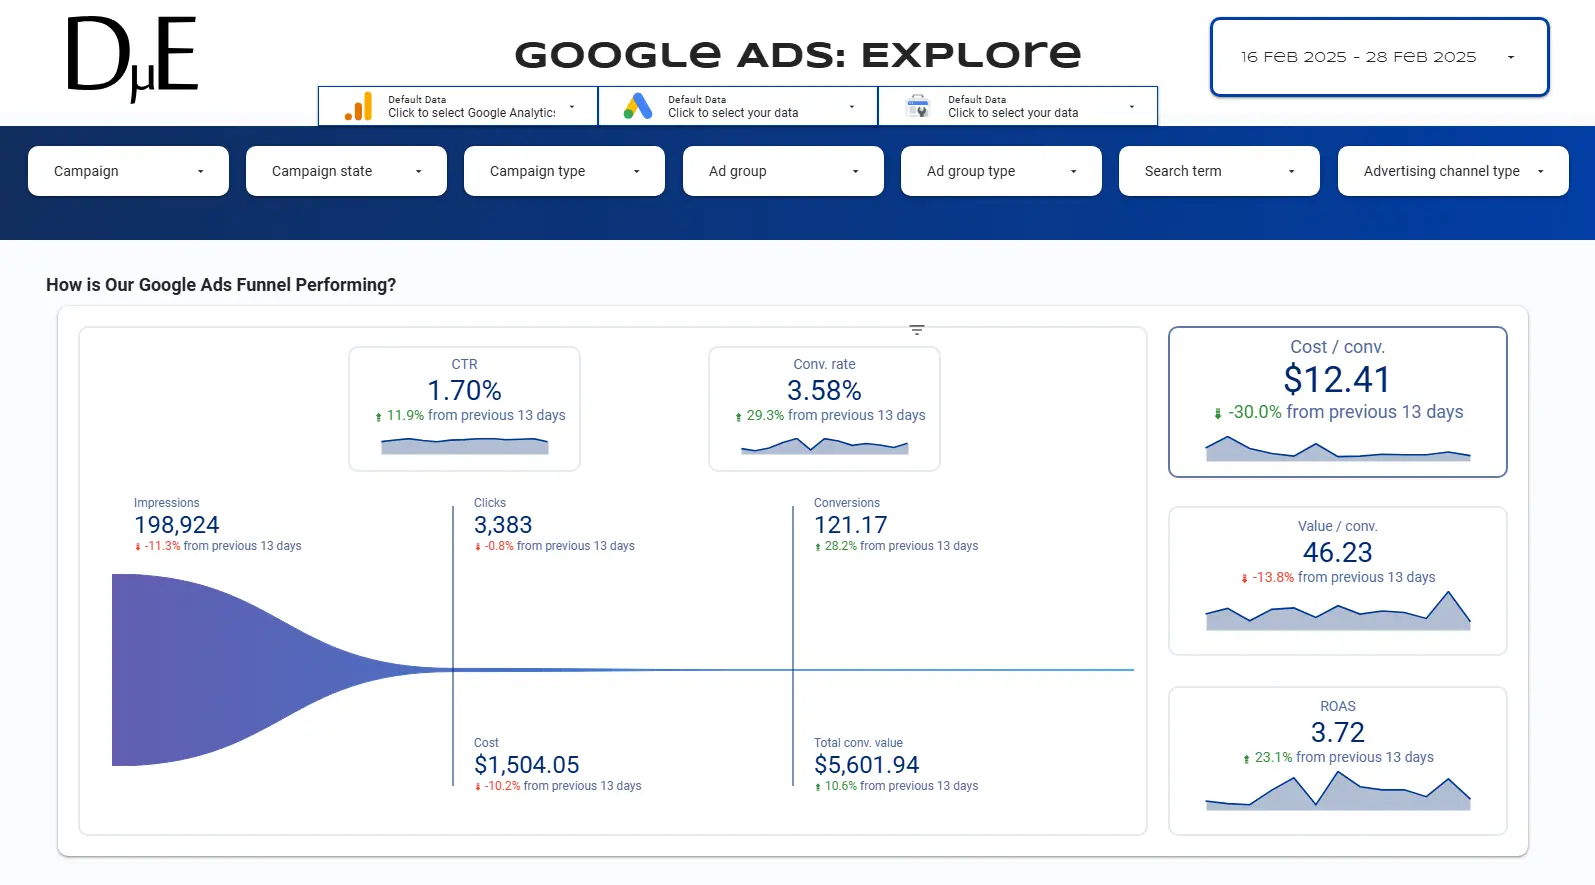
Top of the Google Ads: Explore page of the Google Ads Looker Studio Template, showing dropdowns, scorecards and a custom funnel visualisation


Unlock the hidden potential in your organic search data. Our Search Console Looker Studio Template Section helps you discover ‘striking distance’ keywords – high-impression terms ranking on page 2 where a small push could result in a huge traffic boost. Monitor page performance, analyse CTR, and find the queries that are driving real results.

Search Console Site Impression

Focuses on organic search performance using data from Google Search Console, specifically looking at search queries.

  • What is our overall visibility in organic search (impressions)?
  • How many organic clicks are we getting?
  • What is our average click-through rate from search results?
  • What is our average ranking position?

Search Console URL Impression

Focuses on the performance of specific landing pages in organic search.

  • Which specific pages on our website are attracting the most organic clicks?
  • Which pages have high impressions but low CTR?
  • Which pages rank well?
  • Which pages need content or SEO optimisation?

Search Console Branded vs Non-Branded

Focuses on the performance of Branded vs Non-Branded Queries

  • What is the balance of branded vs. non-branded search traffic?
  • How is our brand equity in search evolving?

Ready to Turn Your Data into a Competitive Advantage?

Start using the Actionable Google Marketing Template free. Stop the guesswork, eliminate wasted ad spend, and start making the data-driven decisions that truly grow your business.

Frequently Asked Questions

Yes. You need a Google Account that has access to the data you want to see, that is, GA4, Google Ads and/or Search Console.

Make sure you are logged in with an appropriate Google Account in the browser you open the template in. Then use the Data Control to the top of the template to select the GA4, Google Ads and/or Search Console accounts you want to see.

The template uses the free Looker Studio Connectors by Google, for:

  • Google Analytics 4 (GA4)
  • Google Ads
  • Search Console

You need GA4 Recommended Events set up in your Google Analytics 4 property. At minimum, you must have the ‘purchase’ event configured. For ecommerce businesses, you’ll need the recommended ecommerce events properly implemented. If you plan to use lead generation features in future templates, you’ll also need the ‘generate_lead’ event configured.

Once your data is properly set up, connecting to the template takes just seconds using Looker Studio’s Data Control feature. This feature allows you to select which GA4 property, Google Ads account, and Search Console property you want to connect to the template from a dropdown menu of accounts you have access to.

Data Control is a Looker Studio feature that lets you switch between different data sources without editing the template. When you open our template, you’ll see dropdown menus where you can select your specific GA4 property, Google Ads account, and Search Console property from accounts you have access to. This makes connecting your data as simple as making a selection from a menu.

No. Our templates are designed for everyone from beginners to advanced users. Beginners can use the templates mostly as-is with simple interactions like dropdown filters. Advanced users have additional options such as drill-down actions on data tables to explore deeper insights.

This template works for any business using Google Analytics 4, Google Ads, and/or Search Console with proper event tracking in place. They’re particularly valuable for businesses that want to understand their marketing performance holistically.

The data sources checks for fresh data every 12 hours. You can manually refresh the data at any time using the Refresh data option in Looker Studio’s menu that appears when you hover to the top.

Unlike other templates that can break, become corrupted, or produce errors when you try to customise them, our Actionable Marketing Template is a locked, view-only report. This isn’t a limitation; it’s a guarantee. It ensures the integrity of the complex data connections and the logic of the Actionable Measurement Framework remains intact. This provides you with a reliable, expert-built view you can trust every time you open it. For a fully editable version built around your unique business KPIs, we invite you to explore our custom measurement services.

The main limitations of the template are:

  • Custom Visualisations (like the Funnel) won’t work with your data. Since the custom visualisation associated with data sources controlled by the Data Control only work with the default, they will not work when you select your accounts from the Data Control.
  • The Questions & Actions section contains sample data.

We provide support for questions about using the templates through our support form. Whether you need help with setup, understanding the data, or interpreting insights, we’re here to help you get the most value from your marketing data.

Do You Have Questions About The Template?